this post was submitted on 27 Jan 2024
507 points (85.0% liked)
Data Is Beautiful
8378 readers
5 users here now
A place to share and discuss data visualizations. #dataviz
founded 4 years ago
MODERATORS
you are viewing a single comment's thread
view the rest of the comments
view the rest of the comments
I don't know about beautiful data. That's scary data :/
It’s only beautiful in that is well visualized. The data itself is scary.
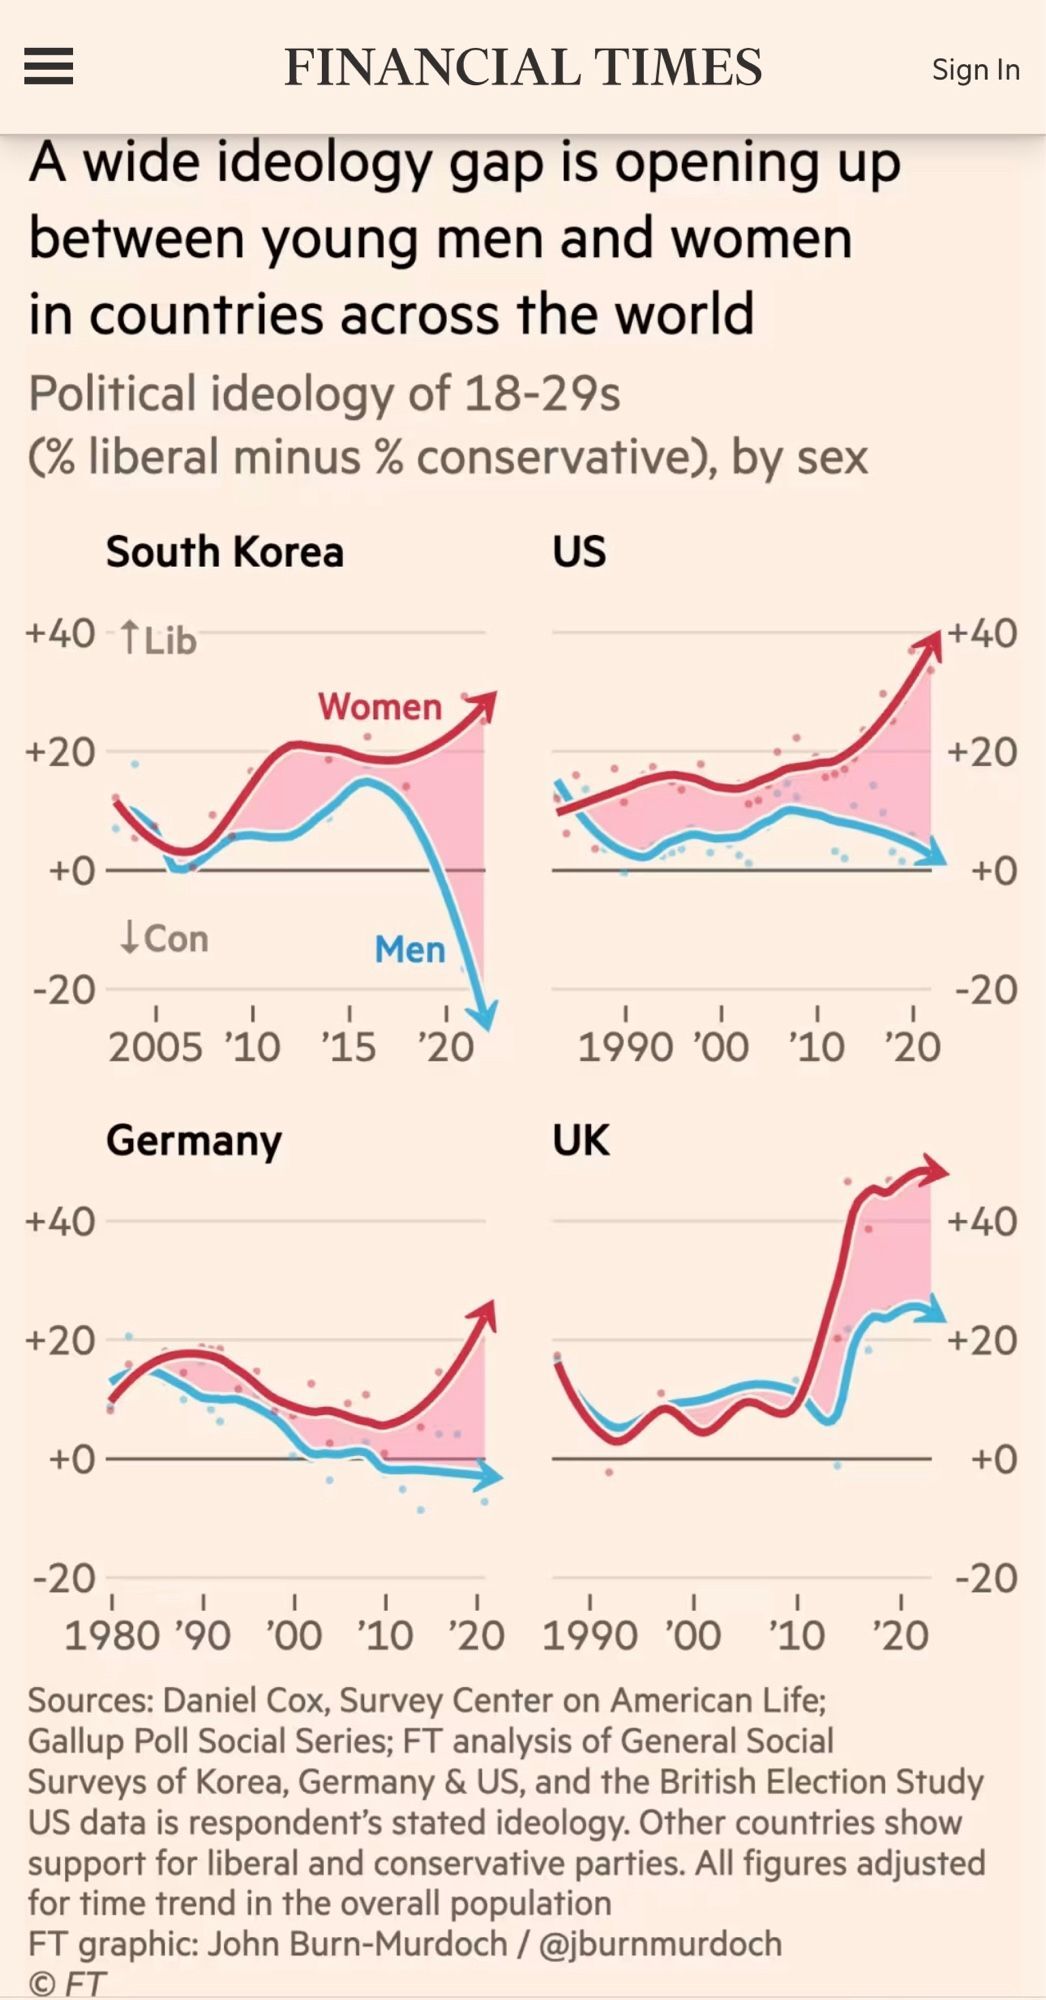
The graps don’t represent the same amount of time while they are there for comparison. I wouldn’t call that well visualized.
South Korea is expanded, which reduces the appearance of disparity. Germany has an extra 10 years. But despite those issues the data is still compelling.
Do you know a community that fits?
Nah, here is fine, the data is presented beautifully.
Except the time frame is shifted for each graph
+1 this. This community isn't about agreeing with the data, it's about how it's presented
No no, that's not what I meant. I wasn't trying to have a go at you. It fits here perfectly. I was just upset at the trend it was showing :\
The data is beautiful, it's the implications that are ugly