this post was submitted on 27 Jan 2024
507 points (85.0% liked)
Data Is Beautiful
8378 readers
7 users here now
A place to share and discuss data visualizations. #dataviz
founded 4 years ago
MODERATORS
you are viewing a single comment's thread
view the rest of the comments
view the rest of the comments
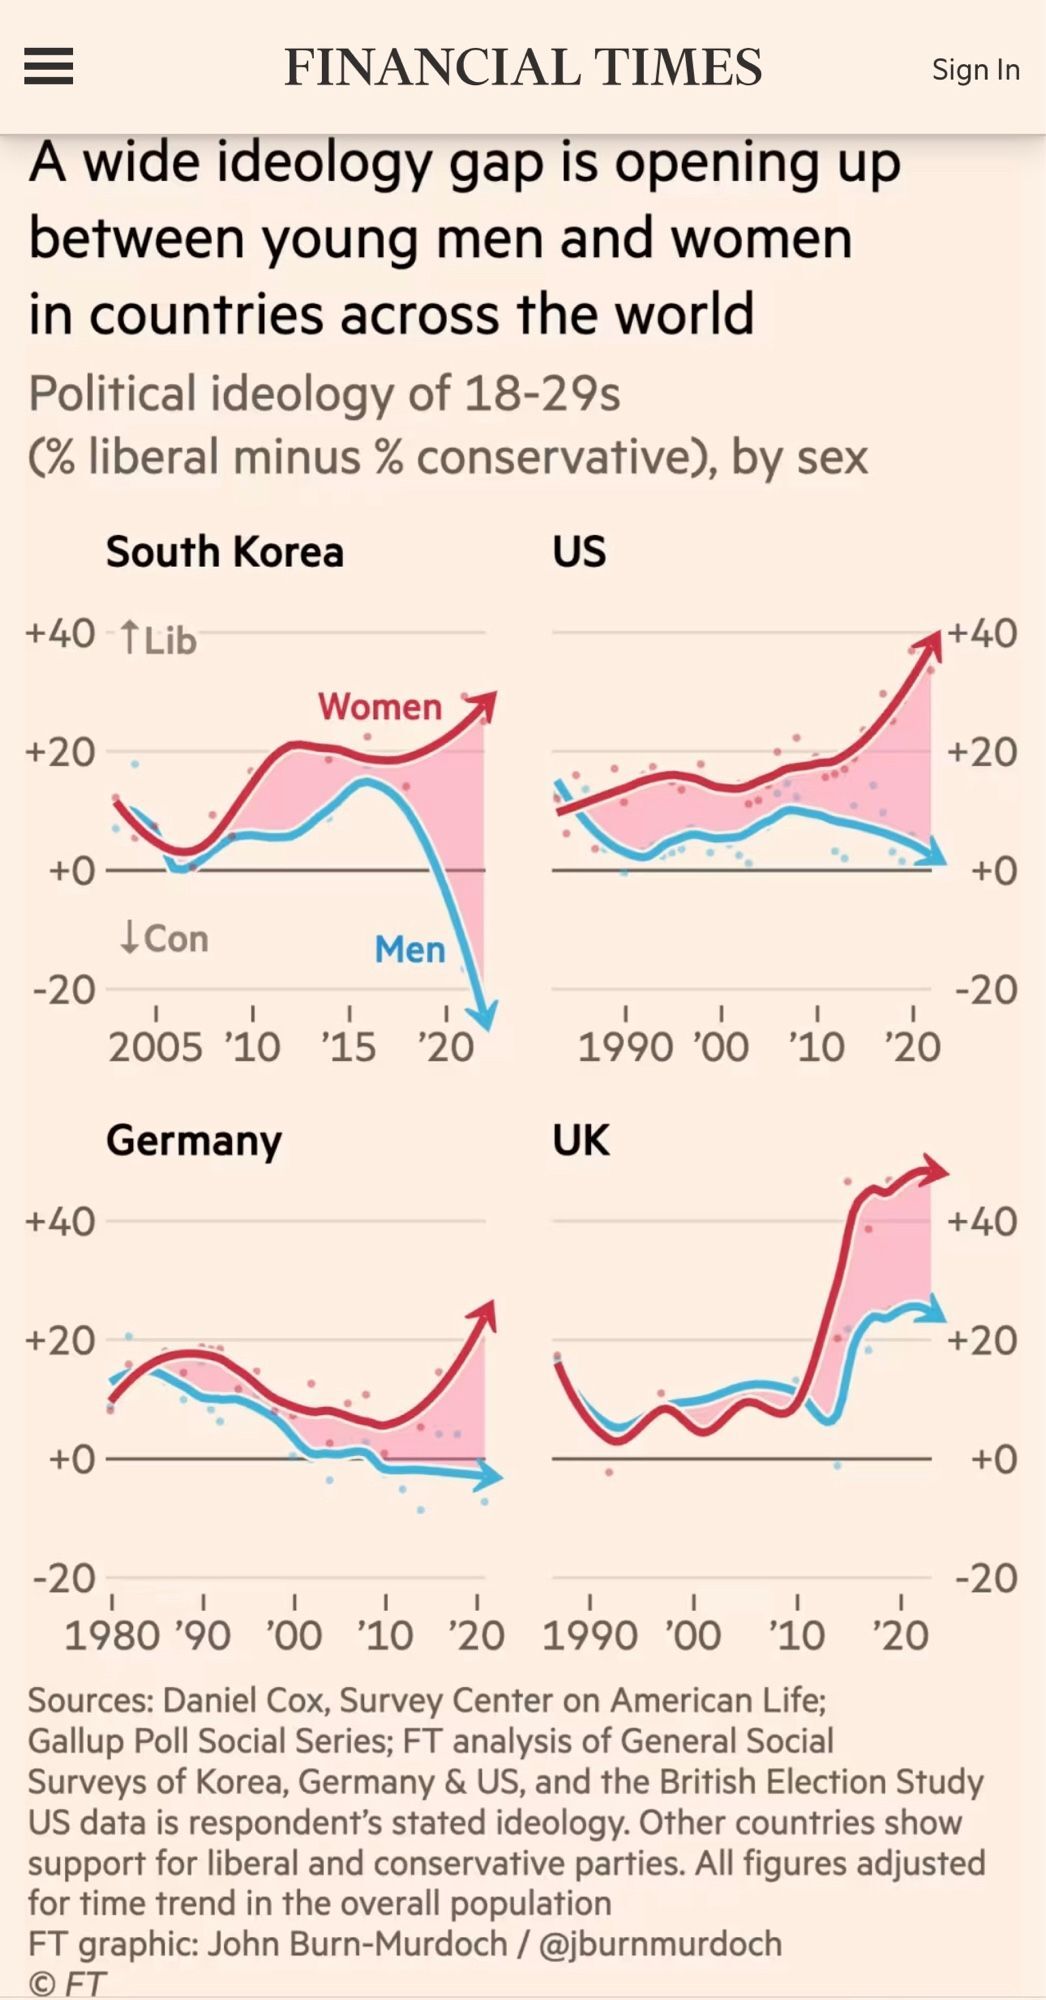
The graps don’t represent the same amount of time while they are there for comparison. I wouldn’t call that well visualized.
South Korea is expanded, which reduces the appearance of disparity. Germany has an extra 10 years. But despite those issues the data is still compelling.