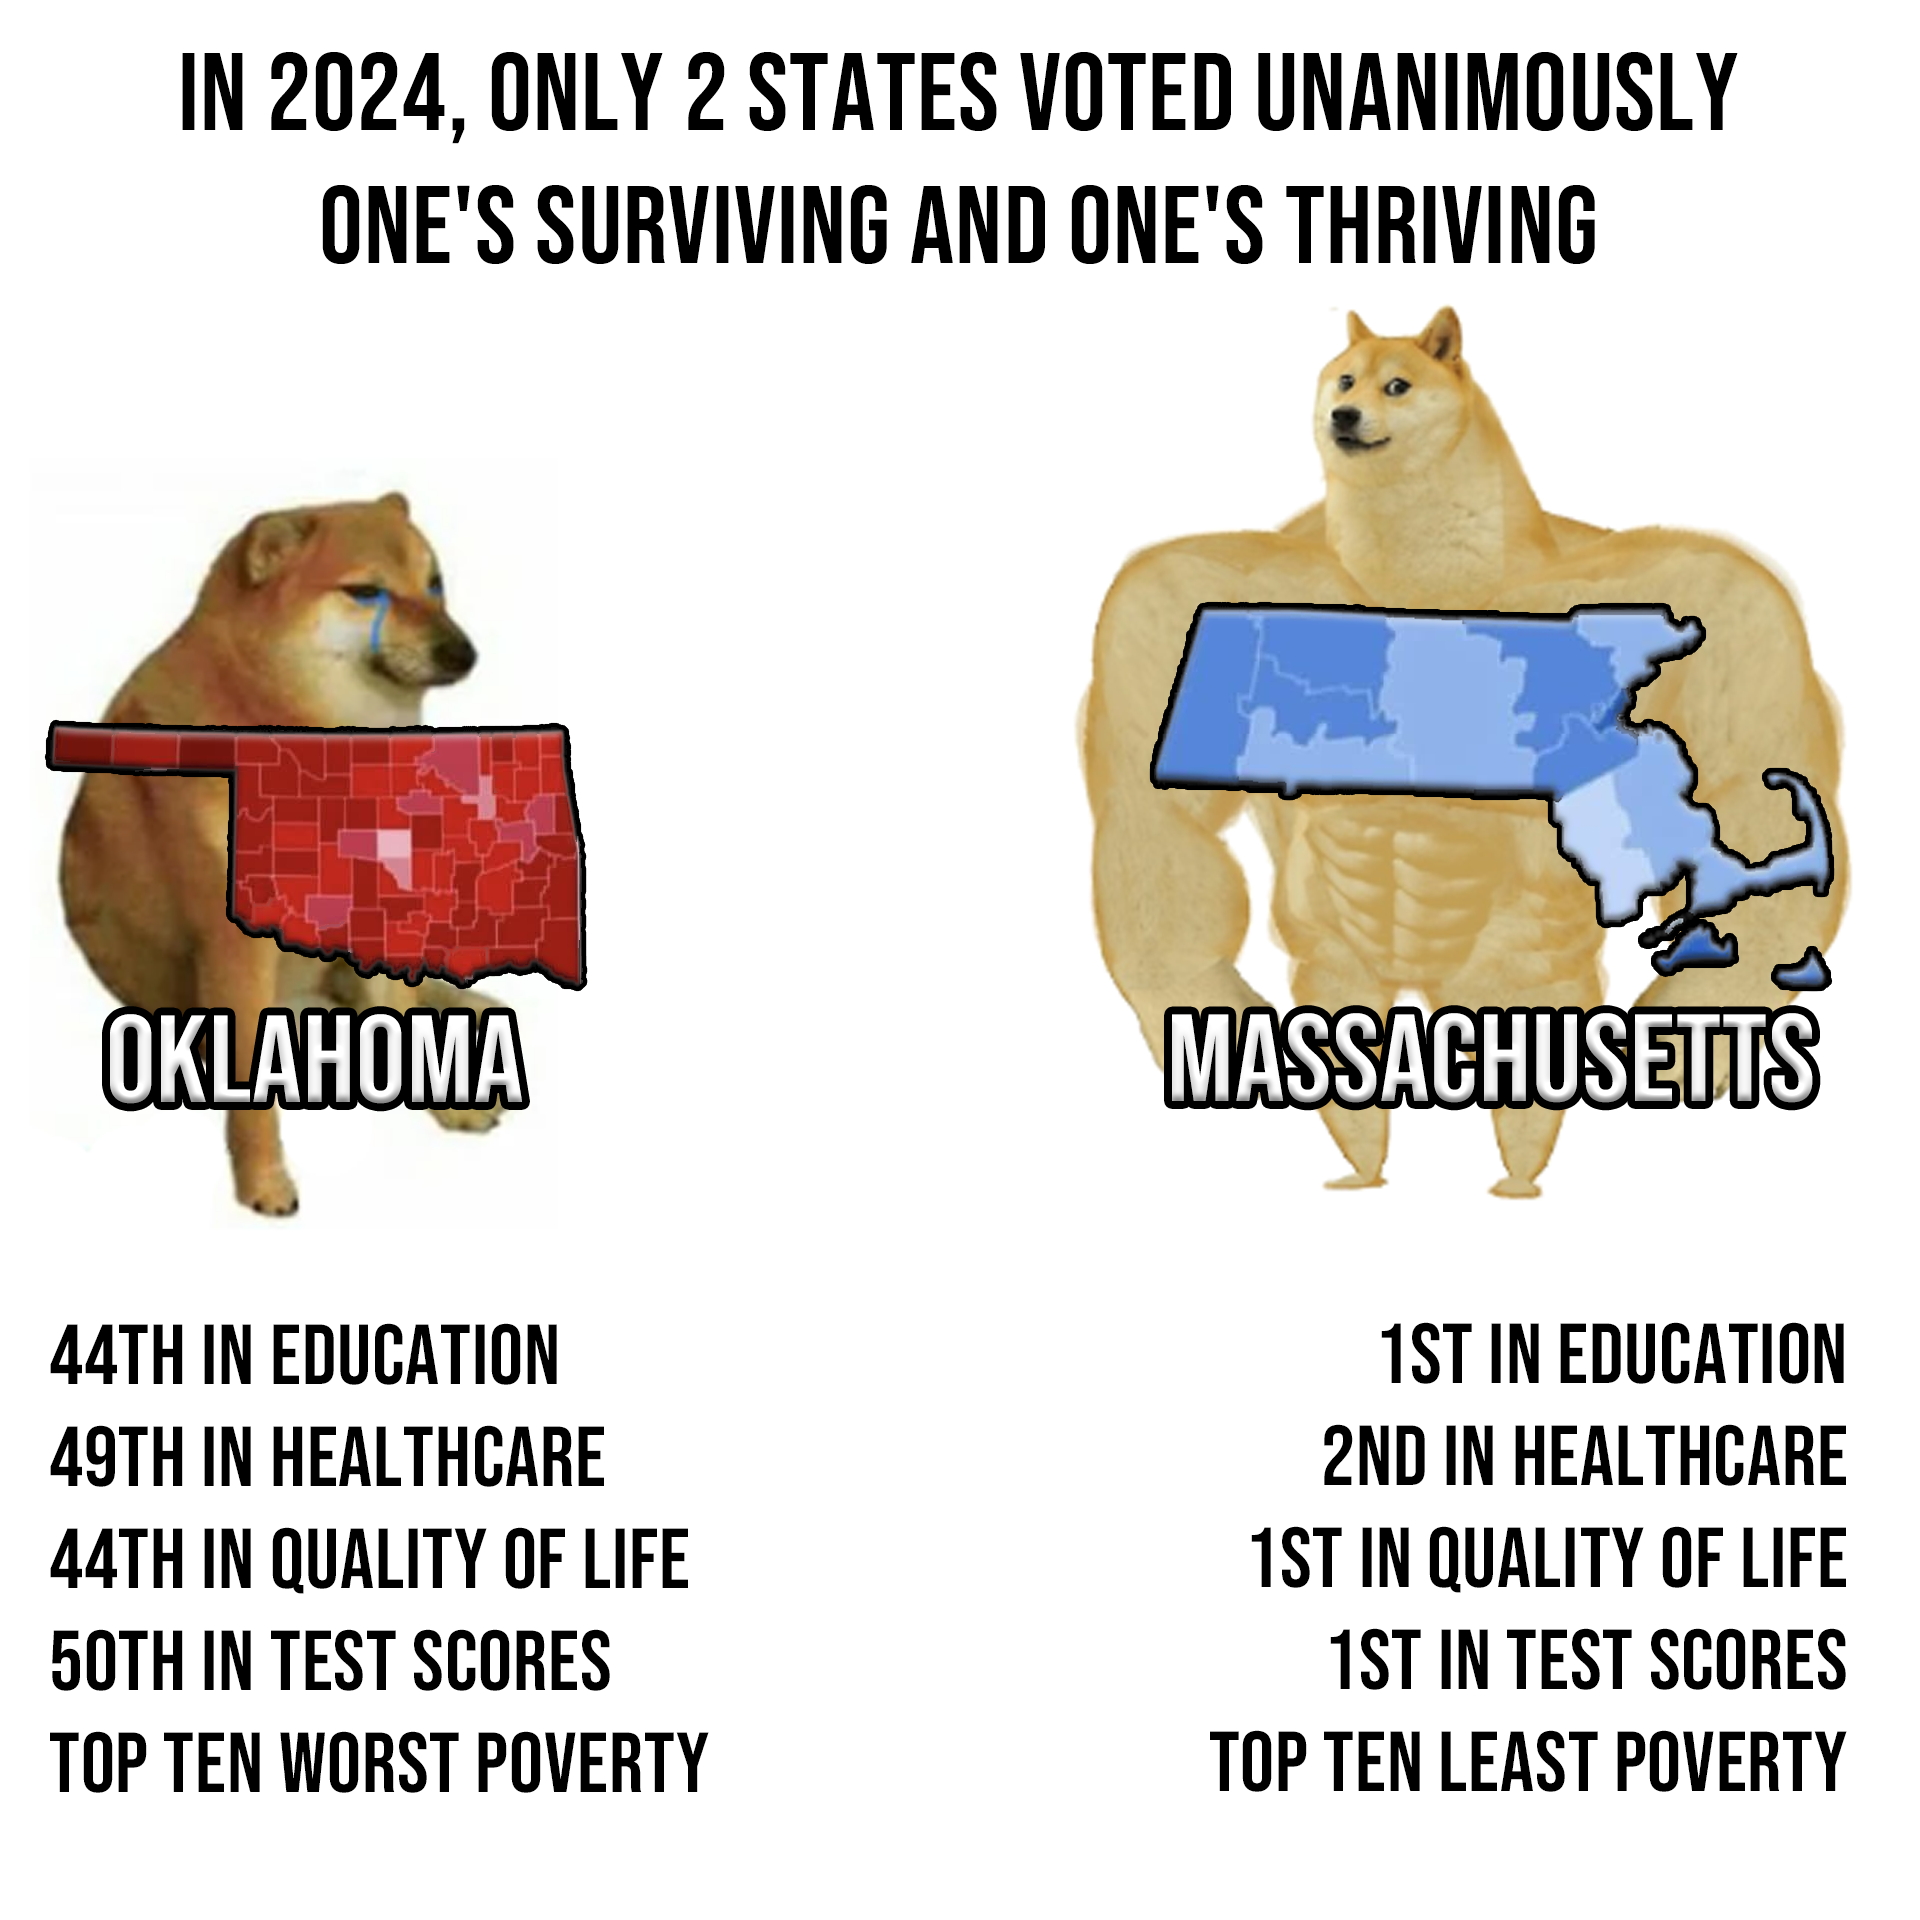
this post was submitted on 16 Nov 2024
1245 points (97.6% liked)
Political Memes
5445 readers
3244 users here now
Welcome to politcal memes!
These are our rules:
Be civil
Jokes are okay, but don’t intentionally harass or disturb any member of our community. Sexism, racism and bigotry are not allowed. Good faith argumentation only. No posts discouraging people to vote or shaming people for voting.
No misinformation
Don’t post any intentional misinformation. When asked by mods, provide sources for any claims you make.
Posts should be memes
Random pictures do not qualify as memes. Relevance to politics is required.
No bots, spam or self-promotion
Follow instance rules, ask for your bot to be allowed on this community.
founded 1 year ago
MODERATORS
you are viewing a single comment's thread
view the rest of the comments
view the rest of the comments

The maps were identical in 2020 (following a republican administration):
Oklahoma 2020
Massachusetts 2020
And 2008 (following a republican administration):
Oklahoma 2008
Massachusetts 2008
Once you get back to pre-social media era internet, you begin to see Oklahoma have shades of blue.
2000 1996 1992 1988
Perhaps we could collaborate on this.
Now that I have pulled Oklahoma’s electoral results going back to 1988, now you can pull Oklahoma’s education results going back over the same period of time and we can see if there is, in fact, a correlation between the quality of education (overall education rankings) and how the state votes in presidential elections.
I suspect that it was not purely the quality of education which influenced the “red shift”. I would bet that the lower-quality of education made the influence of social media more effective for those targeting the less educated to adopt a conservative political position.
Just share your findings here and we can work together.
Well done. I'll leave my response up, but I'll admit that the Massachusetts/Oklahoma example is a bad one to make the case that Trump was the populist in this election and Harris was a vote for the conservative "no change" position.
Ah yes, of course, Kamala was the more conservative option in the last election. Donald Trump is also an actual populist that cares about you. You are very smart. /s
Yes, I believe that was actually true. Look at him, slashing and burning his way through cabinet appointments.
She was definitely the more conservative choice. It's ok that I'm not smart.