so i startet on kbin.social and lemmy.world, but kbin became shitty and overrun with bots. than i switched to kbin.run and now it seems to be down. No idea what actually happened there. Don't think i will start a new kbin/mbin account for now. i think i will just stay on lemmy.world for now and not have an alternative instance as backup
JanoRis
Thanks, i also had it on my wishlist. Nice to get it for free
i think the Gamepass shines the most for coop games. If you have a friend group you regularly play games with it there can be an issue of the different spending habits and willingness to buy games between everyone. Often one person will try to motivate others to get a game and than it gets played a few times and shelved.
The advantage of sports games is probably that most can be played coop, also there is a huge playerbase there that loves to buy lootboxes. Easy way to get whole friendsgroups signed up. I myself dont really like sportsgames that much, at least not if they are by EA.
Though I do hope that gamepass keeps getting more coop games. Especially more couch, casual and partygames. They do already have lots of survival and crafting games so far, which is great.
It's beautiful, but there was a good chance to get stuck everywhere in cars without all-wheel drive. In my neighborhood the snow services dont run through to remove the snow from road and parkings, so you have to do it by hand. Took 3 hours to free our house with 2 people and there was not much place left to shovel the snow too. Over night the temperatures dropped to ~ -12°C so everything is frozen now too. Can't imagine what 70 cm in a day would be like. This was probably the highest single day snowfall i experienced, the only comparable time was i think in 2005
But yeah has been a while since i last saw a white christmas. Nowadays the most snowfall seems to happen in february/march
They explain that in the article. Light barely gets absorbed in water, which is why you can see several meters deep in water. Only the absorbed part can turn into heat.
They measured an effect that partly evaporates water more efficiently than the heat influx can. The theory mentioned in the article is, that light directly knocks out water molecules at the water/air surface boundary. The measured effect was the most effective with light of a green wavelength
Is the company Microsoft?
at least it's on gamepass
devs want to add the possibility to remove custom multiplayer characters in the future, but it seems it is not included in this patch yet
This patch doesn't yet allow the removal of custom multiplayer characters from a party right?
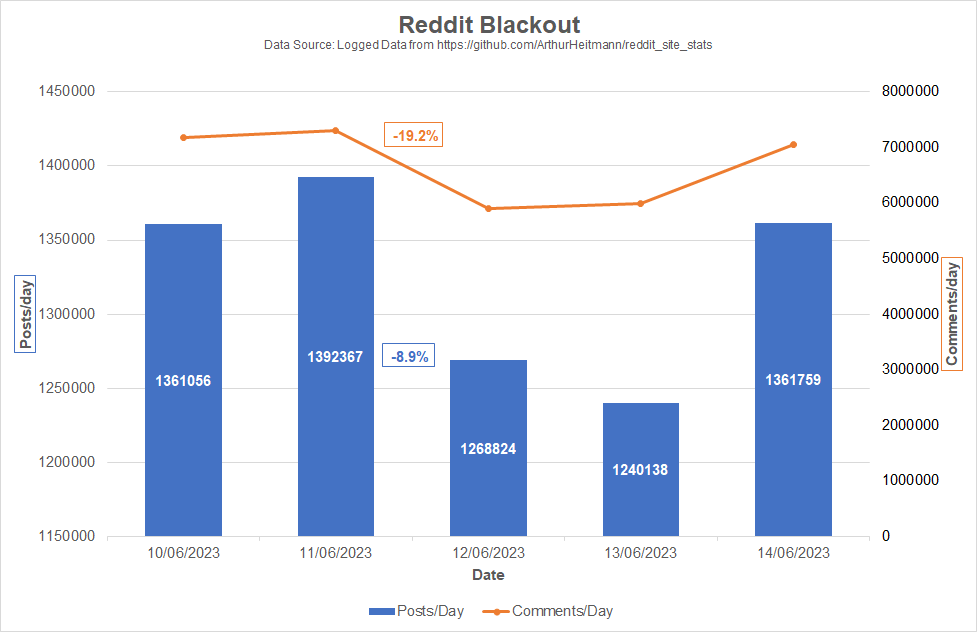
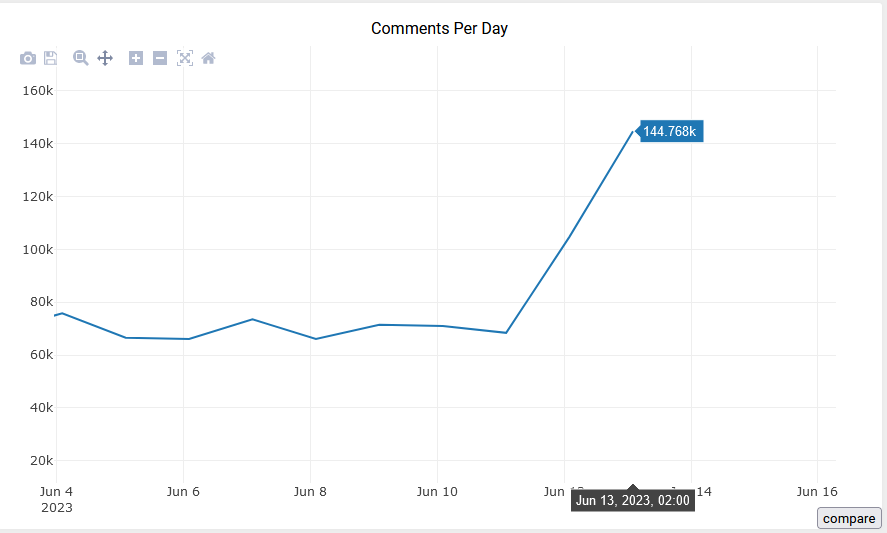
So I took the data from the blackout.photon-reddit site source.
It seems that it makes a Reddit Api call every Minute searching the newest Post and Comment and calculates both per Minute rates.
I wanted to see the effect the Blackout had over the day, so I summed the data and plotted it: Seems like between 11th and 12th June the comments/day diminished by -19.2%. The posts/day saw a decline of -8.9%

The sub with the most Activity was probably Askreddit


They have the same mandated 4 weeks paid vacation as the rest of the EU. National holidays seems to be 11, which is similar to germany.
I do have the impression of france workers going on a strike a lot though, maybe thats what you mean. If you are from the us, i can see how 4 weeks vacation can seem like a lot, you dont have the benefit of having decent employee protections