
Yeah, "what" is right. Wtf is this?
A place for majestic STEMLORD peacocking, as well as memes about the realities of working in a lab.

Rules
Yeah, "what" is right. Wtf is this?
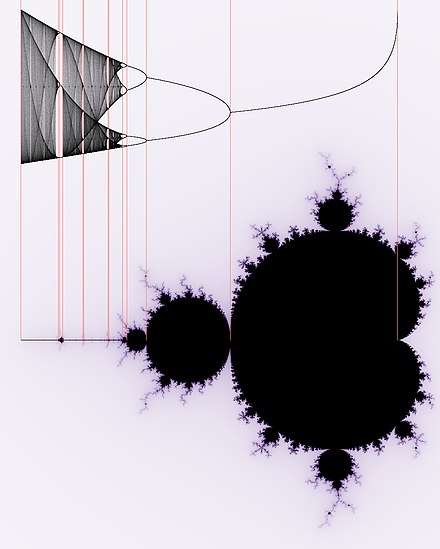
It's making reference to logistic curves and how rabbit populations, which can grow exponentially, will oscillate between a low and high population size.
In short, it explains why some years there are a shit ton of rabbits, and other years, very few.
But there is no oscillation visible here, just aliasing of the lines that make it appear as if there are suddenly none. Note the "none" instead of few. Also it would still not make sense since 1 can not split into 2? And why should the generational succession get faster and faster? 9 woman get 1 child every month kind of math or what?
It’s going well
Is this indicating the triple point of a rabbit?
more like the triple point of two rabbits
And the best part in this is that it all aligns with the Mandelbrot set, for some reason
Edit: Nevermind, it's the bifurcation diagram of the Mandelbrot set that does this.
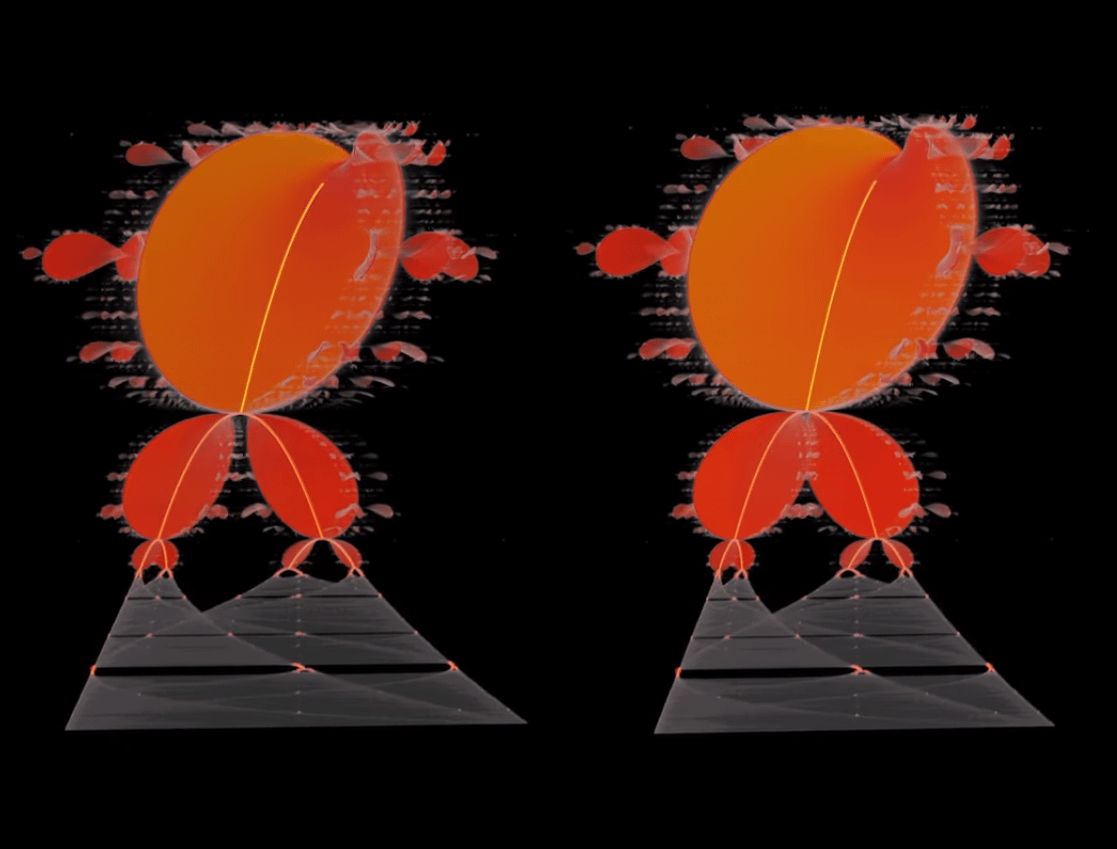
Life is just fractals tbh
funny how you can come to the same conclusions if you're - a) doing science b) doing Buddhism c) doing drugs

It doesn't, the one that aligns is the bifurcation diagram of the function used to make the set (f(z)=z^2+c), which is different from the rabbit one (the logistic map, f(x)=rx(1-x)).
Oh I never knew that!
that's meaningless because every bifurcation map looks the same

As so often with anything related to maths, pi pops out at the most unexpected places.
If you look hard enough, everything has a circle in it somewhere
Nah. 4.669
Yes.