this post was submitted on 26 Oct 2023
0 points (50.0% liked)
Main
139 readers
1 users here now
founded 1 year ago
MODERATORS
you are viewing a single comment's thread
view the rest of the comments
view the rest of the comments
Wonder if they could make this any more confusing.
I agree, they've opted for a tighter grid instead of more clarity. Yes you can figure it out but the point of infographics is to make data more accessible not convolute it for the sake of a more structured design.
I wonder if they'd gone for a single column, vertical style it'd be a lot easier to decipher!
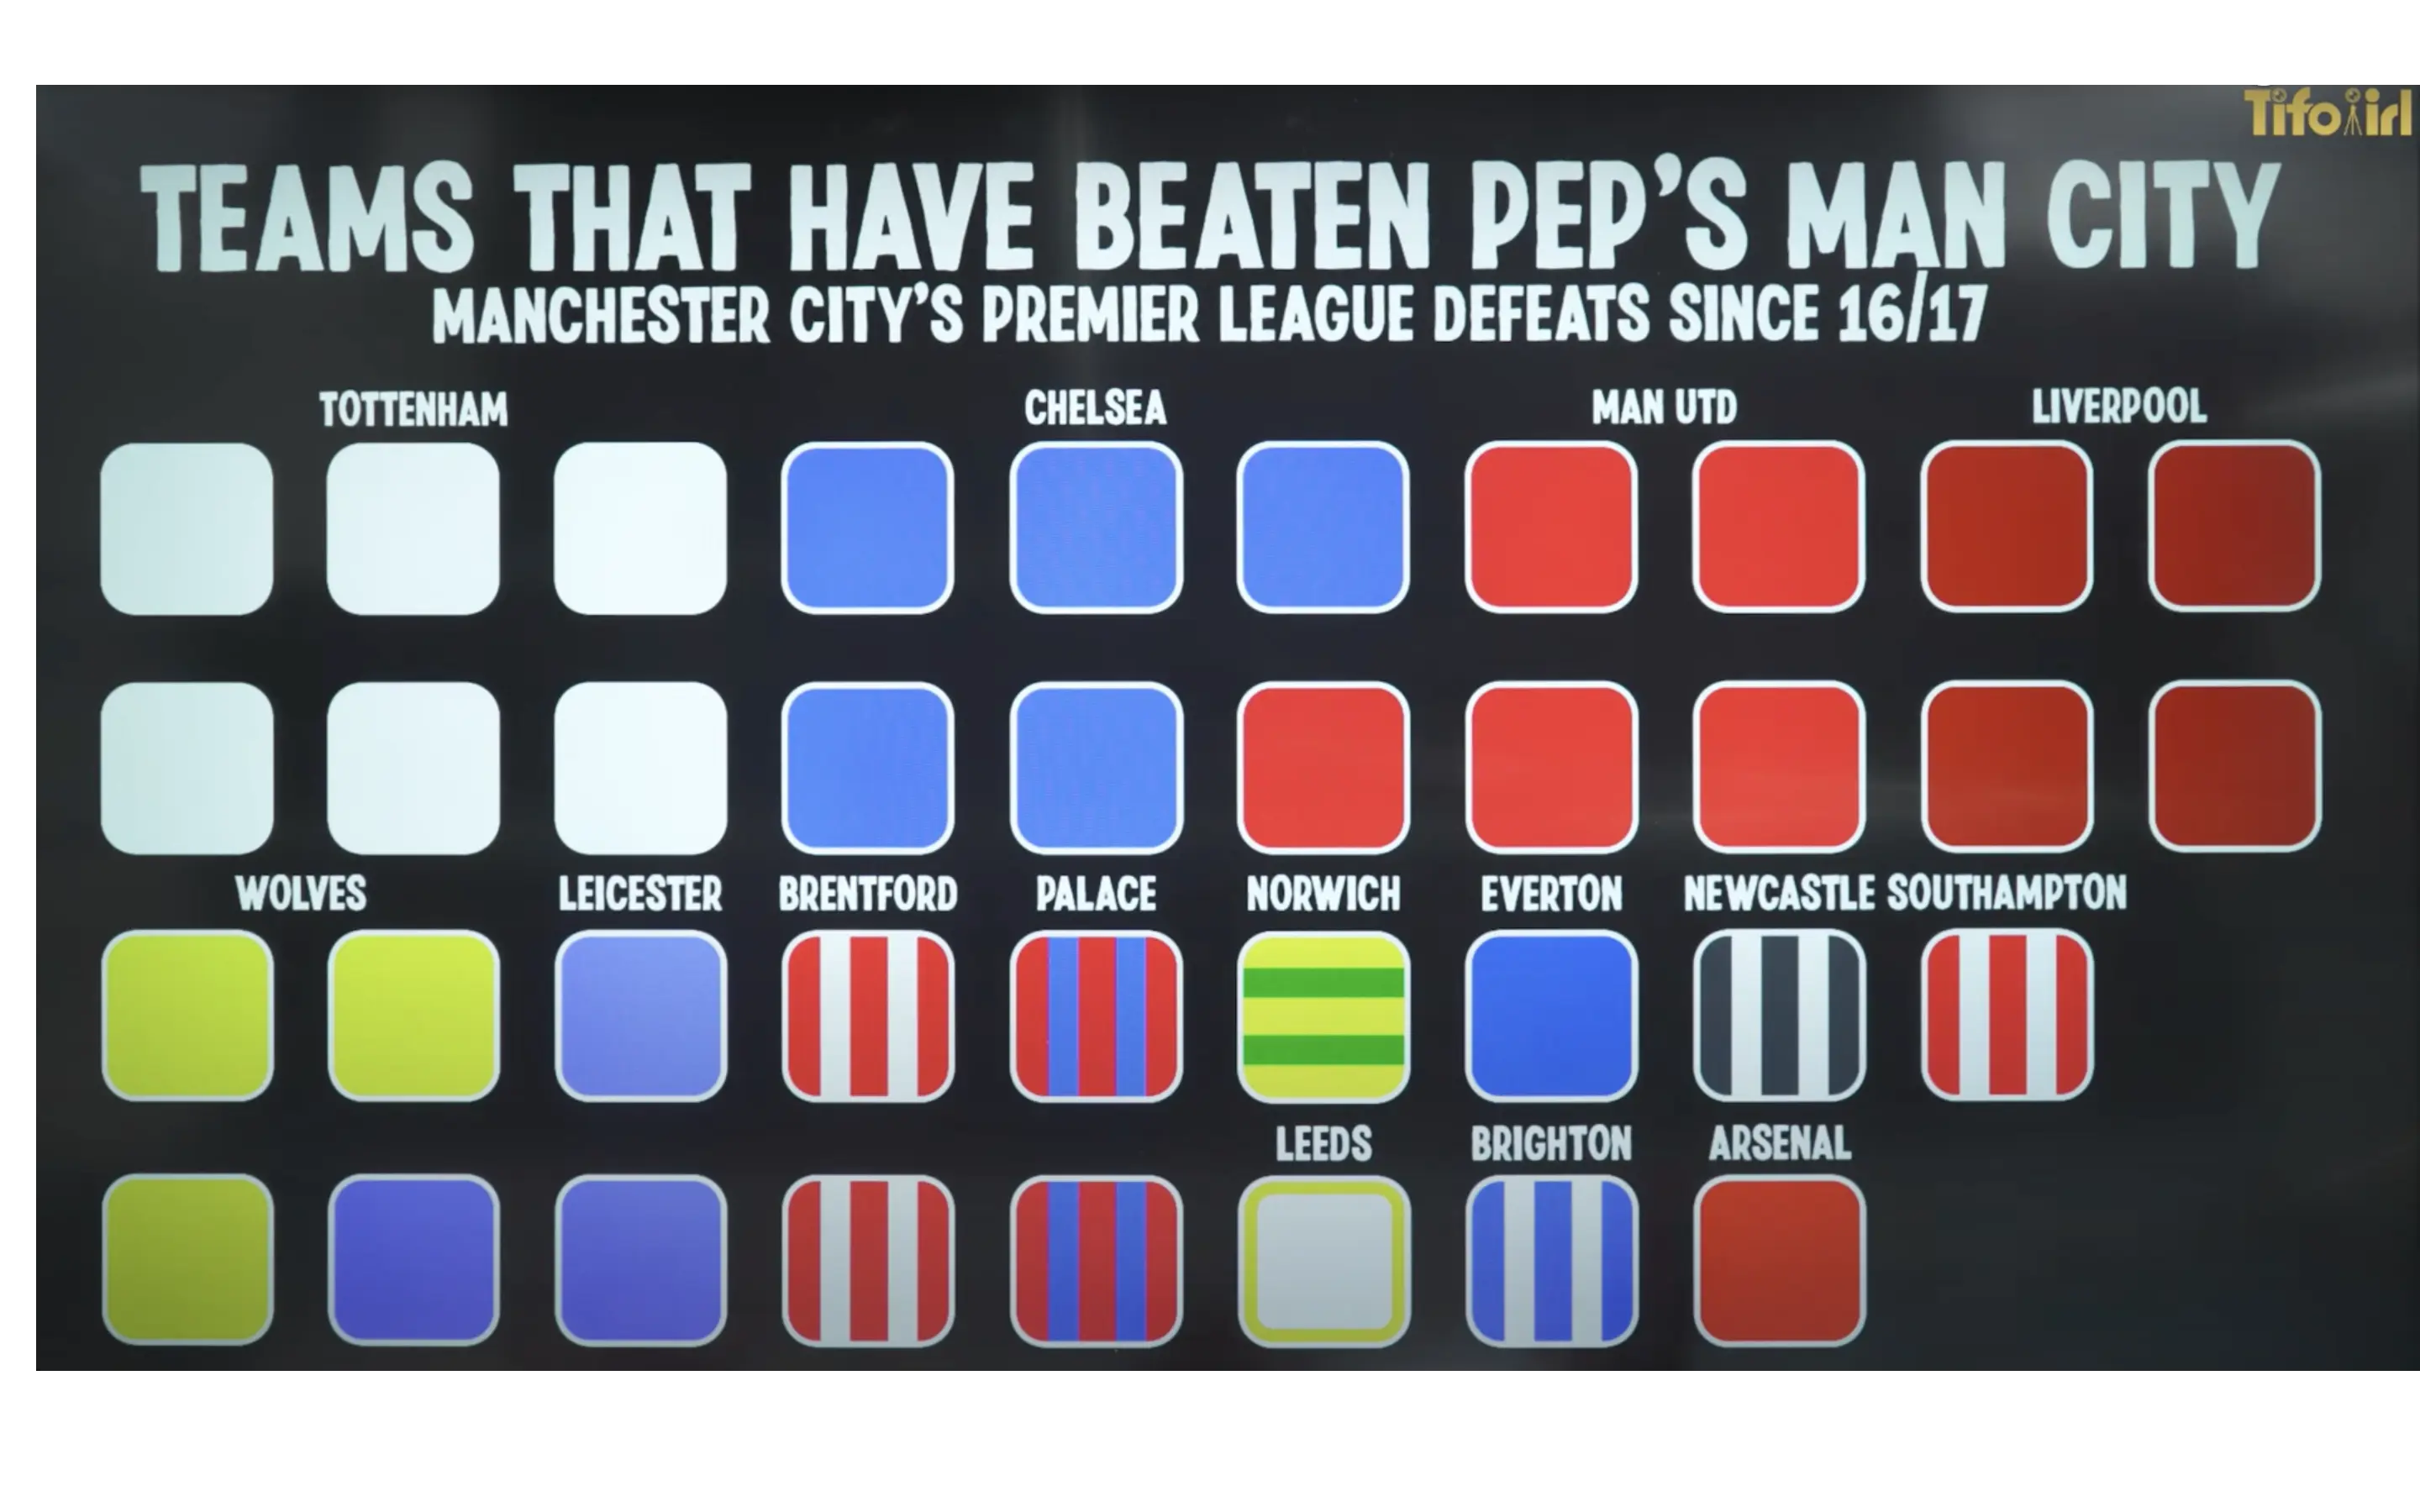
What's confusing about it? You count the amount of same coloured squares below the team name and you get the number of times Pep has lost to that team
Just seems the most convoluted way of doing it.
I'm sure we've beaten Pep's side 4 times which is why I was confused.
Spurs 6, Chelsea 5, utd 5, Liverpool 4, Wolves 3, Leicester 3, Brentford 2, Palace 2,
could jumble them all up, and colour them with slightly different shades of brown