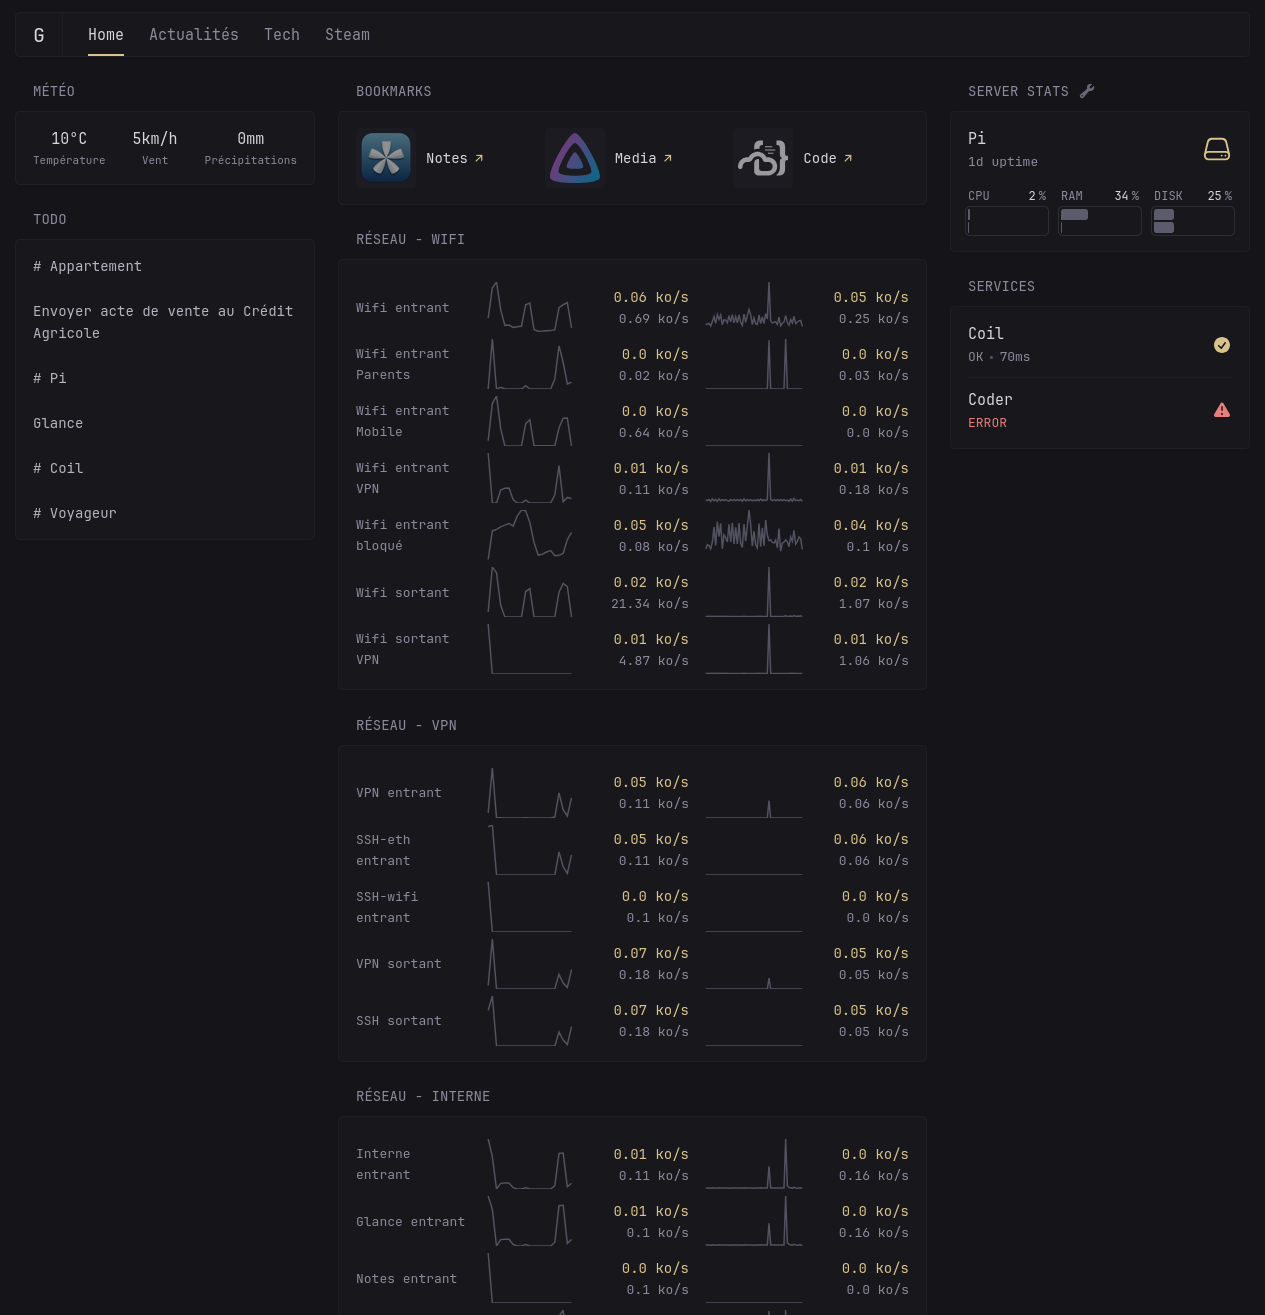
I spent some time learning and configuring my firewall, then displayed it in form of SVG graph on Glance. I'm pretty happy about the result so I wanted to share it :)
A place to share alternatives to popular online services that can be self-hosted without giving up privacy or locking you into a service you don't control.
Rules:
Be civil: we're here to support and learn from one another. Insults won't be tolerated. Flame wars are frowned upon.
No spam posting.
Posts have to be centered around self-hosting. There are other communities for discussing hardware or home computing. If it's not obvious why your post topic revolves around selfhosting, please include details to make it clear.
Don't duplicate the full text of your blog or github here. Just post the link for folks to click.
Submission headline should match the article title (don’t cherry-pick information from the title to fit your agenda).
No trolling.
Resources:
Any issues on the community? Report it using the report flag.
Questions? DM the mods!
I spent some time learning and configuring my firewall, then displayed it in form of SVG graph on Glance. I'm pretty happy about the result so I wanted to share it :)
Just been at it myself setting up my config for glance with custom css theme. Would love to compare notes, how did you get those network graphs going?
It is using Glance extension module (you can send custom HTML by setting up a local web api like Flask) The graph are HTML SVG tags which are basic drawing you just have to input the x,y coordinates of your graph (I copied Glance market chart) For networking data collection and monitoring I've setup my own rules and scripts but it is doable with others network monitoring tools if they let you access data easily