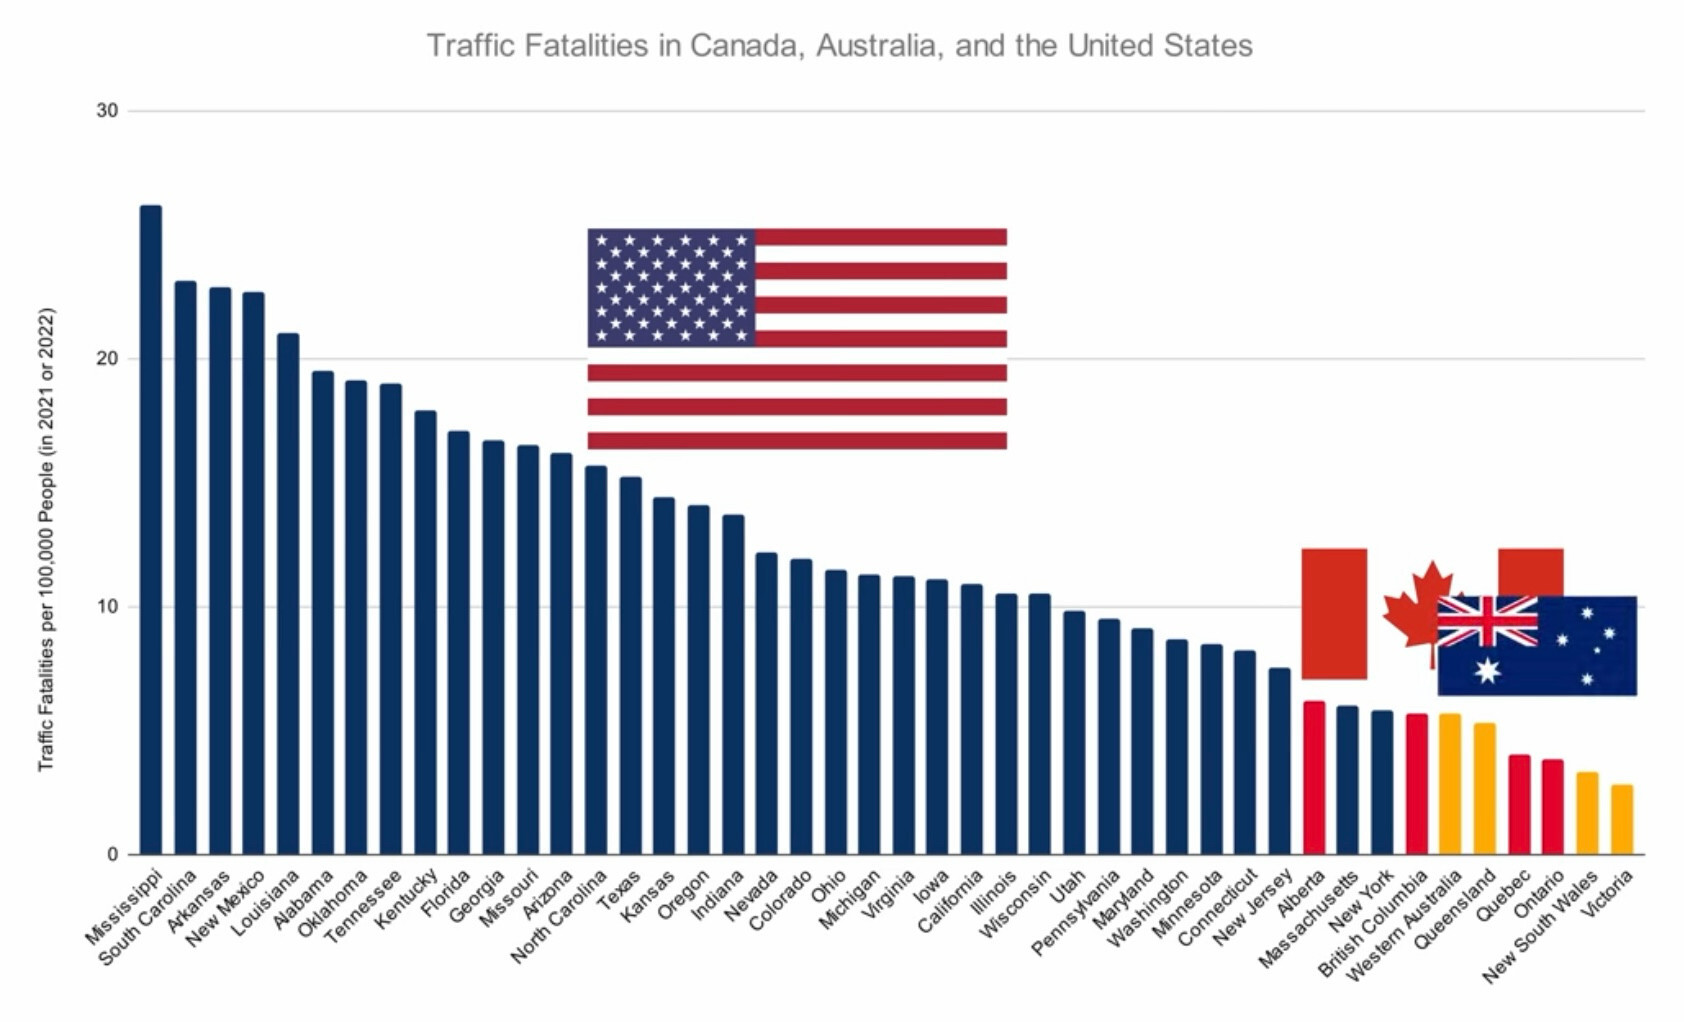
The thing that surprised me most after moving to Oregon was how bad the drivers were. I've lived in many states across the South, the Midwest, and West Coast and I've never encountered drivers so consistently vindictive, entitled and reckless as the drivers in Oregon.
Mildly Interesting
This is for strictly mildly interesting material. If it's too interesting, it doesn't belong. If it's not interesting, it doesn't belong.
This is obviously an objective criteria, so the mods are always right. Or maybe mildly right? Ahh.. what do we know?
Just post some stuff and don't spam.
I assume this includes pedestrians and cyclist deaths? It's by population rather than by "car" or "km driven" but I'd like to see a per county breakdown.
Took a closer look to see if I was surprised by any correlation about poverty, and browsed away with the belief that the south is still a shithole... which might still correlate with poverty. I think kansas/oregon is the first entry that wouldn't be 'south.'
Drinkin' beers an' drivin' yer trukk is a highly traditional pastime in the US deep south. Typically done in the middle of the night, in my experience, for the maximum probability of contacting the local wildlife or making friends at high speed with a tree.
New Jersey is too low. Serious doubts about the validity of this table.
Probably not. The state has been implementing Vision Zero as a statewide program along with several cities.
The two major highways have lower than average accidents due to design.
One of the state's signature traffic configurations, the Jersey Jughandle, eliminates left turn movements on older highways, a major source of accidents.
Jersey is best state, 100%.
Where are Idaho, Wyoming and Montana?
There are only 36 states represented here by my count. It says "major" states, whatever that means. But 14 in total are missing either because of their smaller populations, or because their fatality rate is low enough that they would fall off the right hand side of the chart and thus wouldn't fit the "America Drivers Bad" narrative quietly being implied, here.
Edit: I looked up the numbers for my state in the same year (and no, I'm not telling the public which one). We would be at 1.2 on this chart if my math is correct, which is well below even the shortest bar for Victoria, there.
I decided to look and found that this metric is almost always measured by vehicle distance travelled rather than by population. Basically the graph OP shared is useless and meant to support a narrative, as you stated.
I'd like to see the % of trucks vs cars for each location.
The south is killing it!
SOUTH CAROLINA #2!!!! 🥳🥳🎉🎊🎉🎉🎊🍻🥳🎉🎉🪅
Not surprised by SC, as a Canadian I had one accident in 40 years of driving, it was in SC, caused by a 17yo girl driving an old suburban or something.
